More detail on the game is given in the following papers:
The Parade Game simulation was originally developed by Iris Tommelein, as part of her research on lean construction and new technologies for materials management. This work is funded by grant CMS-9622308 from the National Science Foundation, whose support is gratefully acknowledged. Any opinions, findings, conclusions, or recommendations expressed on this site are those of the authors and do not necessarily reflect the views of the National Science Foundation.
![]()
The documentation presented below of the computer implementation of the Parade Game, developed by Huyn Jeong Choo, is written up as (click on the title below to download the .pdf file):
 Choo, H.J. and Tommelein, I.D. (1999). "Parade of Trades: A Computer Game for Understanding Variability and Dependence." Technical Report 99-1, Construction Engineering and Management Program, Civil and Environmental Engineering Department, University of California, Berkeley, September.
Please cite this document when referencing the computer game described on this web page.
The Parade of Trades computer program simulates a dice game. The purpose of this game is to demonstrate the impact variability and dependence have in a construction environment where multiple trades follow each other in a linear sequence and work output by one trade is handed off to the next trade. The term "parade of trades" was coined by Gus Sestrup, a superintendent with Turner Construction.
Greg Howell used the Parade of Trades Game at the 6th Annual Conference of the International Group for Lean Construction and the Lean Construction Institute has been using it at many of their workshops to demonstrate the effects of variability and dependence on work flow. The game was studied and documented in detail by Tommelein et al. (1998, 1999). They used Stroboscope (Martinez 1996) to simulate the Parade Game and collect statistics from the simulation. Alarcon and Ashley (1999) used @Risk (1997) to simulate a slightly modified dice game and analyzed its impact on project cost and schedule.
The present program allows a user to simulate the Parade Game on a computer. By automatically keeping track of the number of rolls (executions per trade), the number of outputs passed to the next trade, and the number of outputs in each buffer between trades, the program helps the user understand what impact variability and dependence may have on work flow.
The rules of the Parade of Trades Game are here explained step by step. The figure below depicts an example of the status of the game at the start. It shows the capacity of each trade, that is, the maximum number of units of output they could produce in a given time unit. Half of the time, trades 1 and 4 can output 2 units, and the other half of the time, 8 units. Similarly, trades 2, 3, and 5 will half of the time output 1 or 9 units.
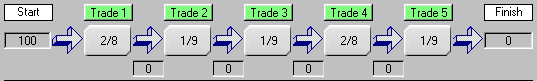
The Game is called a dice game because it is usually played with a blank die on which one number is written on three faces and another number on the other three faces. Rolling the die simulates the generation of random numbers. Players can make up their own game by writing any numbers on the faces of the die.
As determined by a roll of die 1, trade 1 is able to output 2 units (shown in red). Since there are 100 units to be passed and all are readily available as input to trade 1, trade 1 is able to hand over 2 units. This results in 2 units in buffer 1, which builds up between trades 1 and 2.
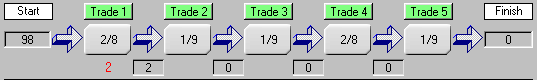
As determined by a roll of die 2, trade 2 is able to output 9 units (shown in red). Since there are only 2 units in buffer 1 available as input to trade 2, trade 2 is able to hand over only 2 units. This results in 2 units in buffer 2. Clearly, the rule is that a trade can take from the buffer ahead of it only up to the total number available, irrespectively of its capacity (i.e., the outcome of the roll).
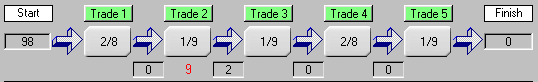
As determined by a roll of die 3, trade 3 is able to output 1 unit (shown in red). Since there are 2 units in buffer 2, trade 3 is able to hand over 1 unit, resulting in 1 unit in buffer 3.
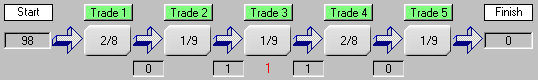
As determined by a roll of die 4, trade 4 is able to output 8 units (shown in red). Since there is only 1 unit in buffer 3, trade 4 is able to hand over 1 unit, so there is one unit in buffer 4.
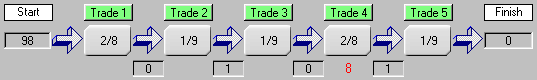
As determined by a roll of die 5, trade 5 is able to output 9 units (shown in red). Since there is only 1 unit in buffer 4, trade 5 is able to hand over only 1 unit, so 1 unit has been finished.
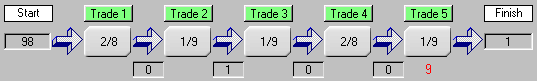
A similar process continues until there are no units left to pass in any buffers, i.e., all 100 units have been finished.
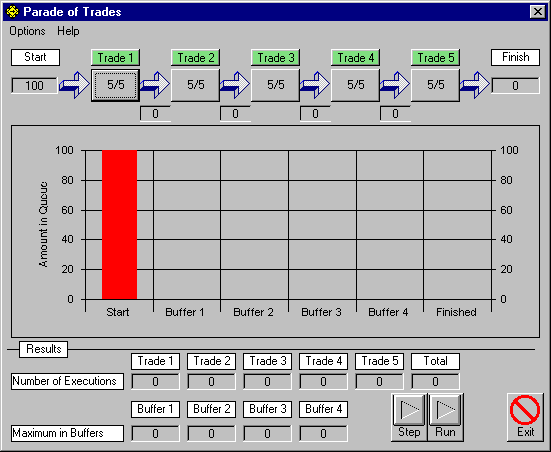
The figure above shows the main screen of the program. It is divided into three sections. The top section above the bar graph is the input section. Five boxes connected by arrows represent five trades where trade 1 follows trade 2 and so on. It is assumed that 100 units of product are to be passed through the parade of trades. The numbers in each box represent the number of outputs each trade is able to produce in one time unit. The default value is 5/5, which represents that the trade will always be able to output 5 units in one time unit. By clicking on the boxes, the user can change the numbers to preset choices &emdash; 4/6, 3/7, 2/8, 1/9 &emdash; each of which has a 50/50 likelihood of occurring. Note that all alternative pairs have an average of 5. For example, 4 ´ 50% + 6 ´ 50% = 5.
|
The user can assign any other numbers to describe the capacity of any trade by clicking on the corresponding "Trade 1", "Trade 2", "Trade 3", "Trade 4", or "Trade 5" button such as the one shown on left. |
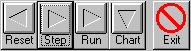 |
Four control buttons are located on the main screen. The "Reset" button resets the data of the program, i.e., returns the program to its initial status. The "Step" button allows the user to execute the rolling and passing process one step at a time and better see what is going on. Pressing the "Run" button will automatically perform the rolling and passing process until all 100 units are passed through the parade of trades. Pressing the "Chart" button allows the user to see a graph of the cumulative number of units passed (line of balance) and the buffer profiles (explained later). The "Exit" button allows the user to close the program. |
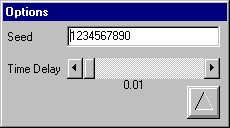 |
Two options, "Seed" and "Time Delay", can be set in the "Options" screen (shown on left) by selecting options from the menu bar. The seed drives the generation of random numbers in the simulation. By selecting a certain "Seed", the user can predictably reproduce the outcome of a simulation. Changing the "Time Delay" allows the user to control the speed of simulation for automatic execution that occurs when the "Run" button is pressed. By pressing the button with upward pointing triangle, the user will return to the main screen. |
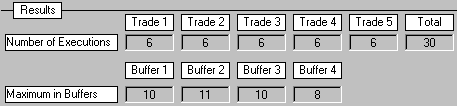
The following example will better explain the Parade of Trades program. The possible outcomes for trade 1 and 4 are 2/8 and that for trades 2, 3, and 5 are 1/9. The statistics after six rolls of the die for each trade are as shown below.
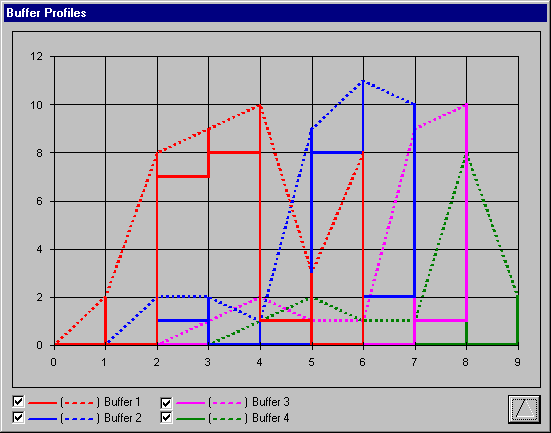
The "Number of Executions" line shown below displays the number of executions performed by each trade and the sum of those numbers. The "Maximum in Buffers" line keeps track of the maximum number of units in each buffer. Buffer 1 refers to the buffer between trades 1 and 2, buffer 2 refers to the buffer between trades 2 and 3, and so on.
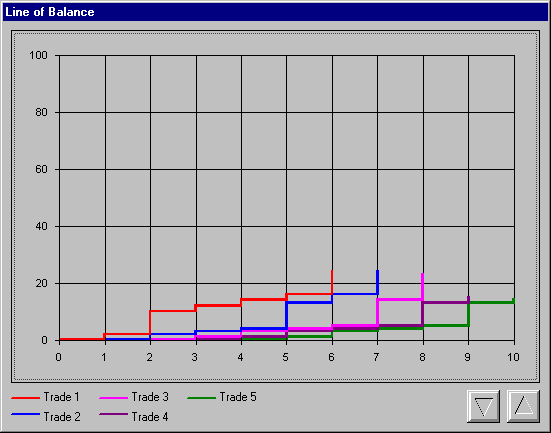
The graphs generated from the statistics generated during the simulation are depicted below. The first graph shows the cumulative total of the number of units passed also known as the line of balance. By comparing the steps of adjacent lines, the user can gauge the effect one trade’s productivity has on the next ones (note that the overall slope of the line decreases for downstream trades). The second graph shows the buffer profiles. The continuous line shows the build-up and depletion of the buffers, whereas the dashed line shows the maximum build-up of buffers.
Alarcon, L.F. and Ashley, D.B. (1999). "Playing Games: Evaluating the Impact of Lean Production Strategies on Project Cost and Schedule." Proc. 7th Annual Conf. of the Intl. Group for Lean Constr., IGLC-7, 26-28 July held at the Univ. of California, Berkeley, CA, pp. 263-273.
Martinez, J.C. (1996). STROBOSCOPE State and Resource Based Simulation of Construction Processes. Ph.D. Diss., Civil & Envir. Engrg., Univ. of Michigan, Ann Arbor, MI, 518 pp.
@RISK (1997). Advanced Risk Analysis for Spreadsheets: User Manual. Palisade Corp., Newfield, New York.
Tommelein, I.D., Riley, D., and Howell, G.A. (1998). "Parade Game: Impact of Work Flow Variability on Succeeding Trade Performance." Proc. 6th Annual Conf. of the Intl. Group for Lean Constr., IGLC-6, 13-15 August held in Guaruja, Brazil, 14 pp.
Tommelein, I.D., Riley, D., and Howell, G.A. (1999). "Parade Game: Impact of Work Flow Variability on Trade Performance." ASCE, J. of Constr. Engrg. and Mgmt., Sept./Oct. Issue.
| Prof. Iris D. Tommelein | Hyun Jeong Choo | More about Lean Construction | CE&M Program | CEE Department | U.C. Berkeley |